Last time I showed how to create a data lake, but how do you get data into it? What format should you store it in?
Common Data Model
The common data model format provides a standard way of storing both the data and associated metadata. This means the tools we’ll use to query the data can load and use the data without having to describe what the data is each time.
As well as being a way to store data, the Common Data Model also describes a number of common “entities”, or tables. If you use Dynamics 365 you’ll already be familiar with these – things like Account, Contact, User etc. The Common Data Model defines the schema of these standard entities so, if your data fits that model, applications that understand the CDM can work with them straight away.
Of course, your data might not fit with one of these existing entities, so you’re free to define your own as well.
Loading data from CDS / D365
If your data is already in CDS / D365, it’s straightforward to get it into Azure Data Lake. From the maker portal, expand the Data menu on the left and side and select “Export to data lake”. Here you can create a link to your data lake account by simply selecting it from the list (you must have already created your data lake account in the same region as your CDS instance. If you’ve only just created it and get errors setting up the link, wait a few minutes and try again).
Once you’ve linked your CDS instance to your data lake you can simply select which entities tables to export. You can’t pick and choose individual attributes to include, or limit which records get exported – it’s an all-or-nothing thing.
The system will then start an initial synchronisation process. From then on it will keep the data lake in sync with hourly updates including any changes made in CDS.
Loading data from a file
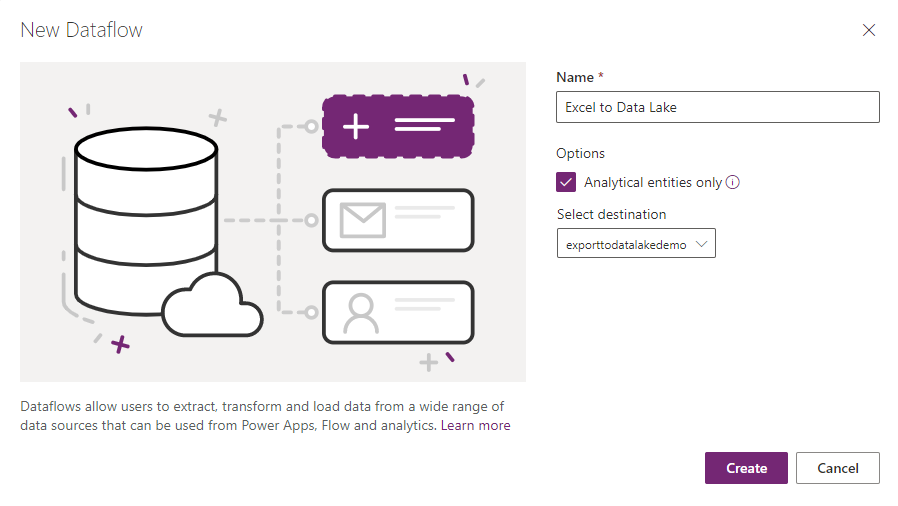
To load other data sources into Azure Data Lake in CDM format, you can use a Dataflow. These are available as part of Power BI or PowerApps – I’ll be looking at the Power Platform (PowerApps) version. In the maker portal, expand the Data menu on the left hand side and select Dataflows. Click “New dataflow”, give it a name and be sure to select the “Analytical entities only” box. By default the data flow will load your data into CDS, but with this option enabled you can choose a linked data lake as the target instead.
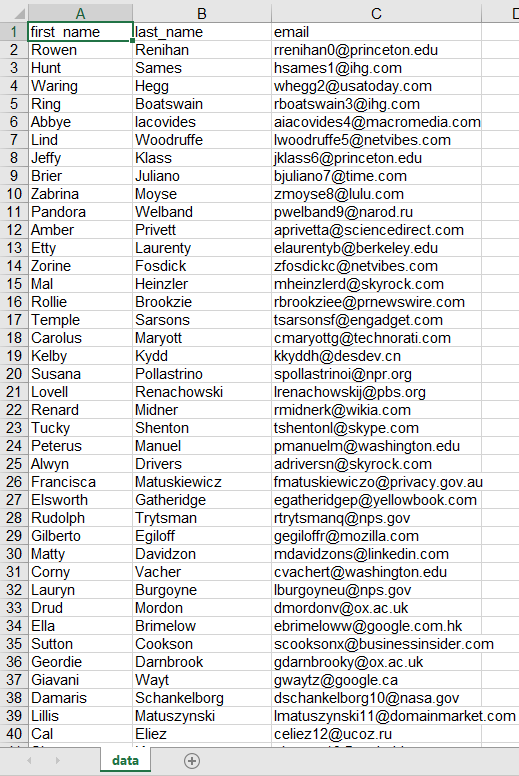
Dataflows use Power Query to select and transform your data. You can do a lot of powerful processing on your data at this point, but for now I’ll do a straightforward load of my data from Excel. This is just some randomly generated test data from Mockaroo:
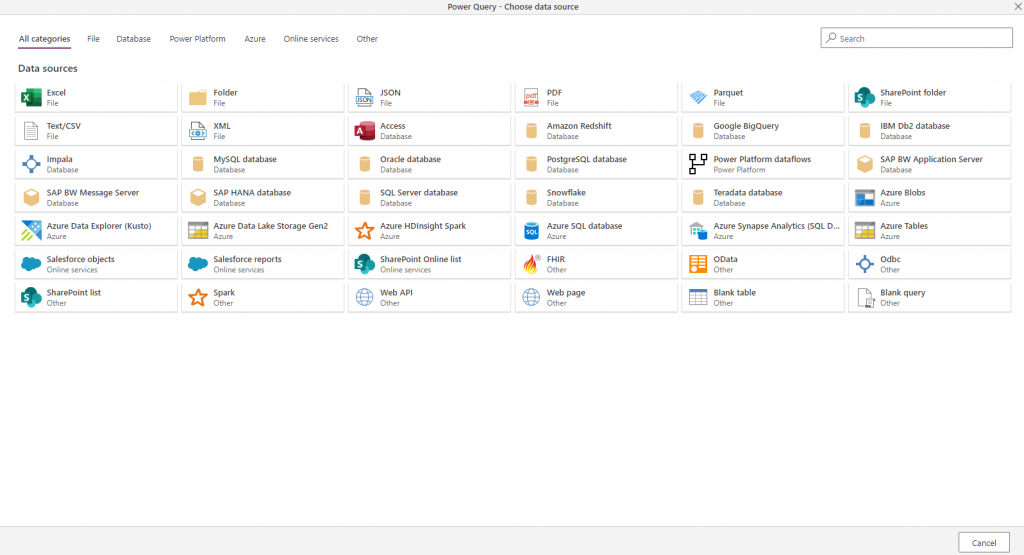
Back to my dataflow, I first need to select the data source. There’s plenty to choose from:
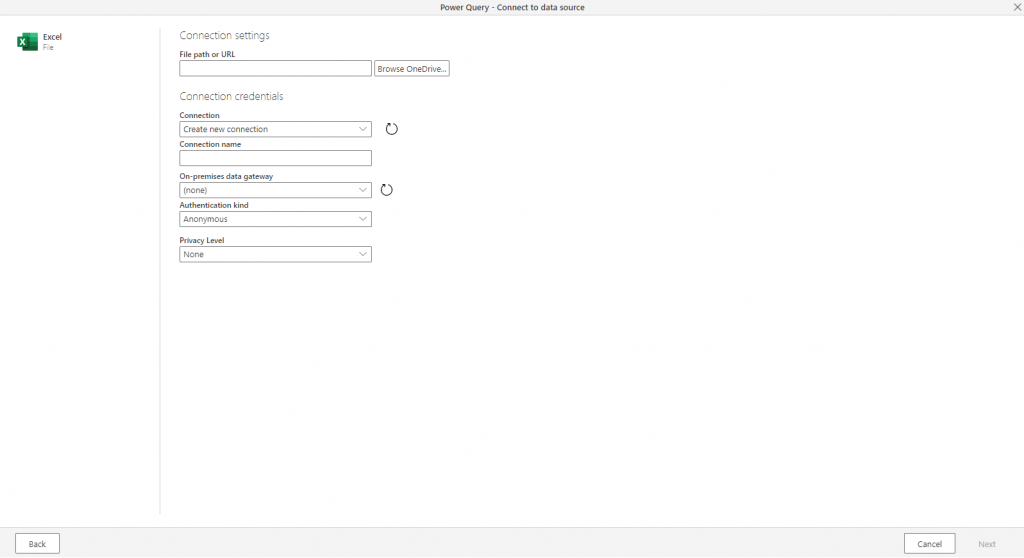
After selecting Excel I just need to choose what file I want to import. There’s options here for selecting a file on your local network using an on-premise data gateway, but my file is in OneDrive so it’s just a few clicks away:
Next it shows me a list of the data available in the file. I’ve ticked the sheet I want to import:
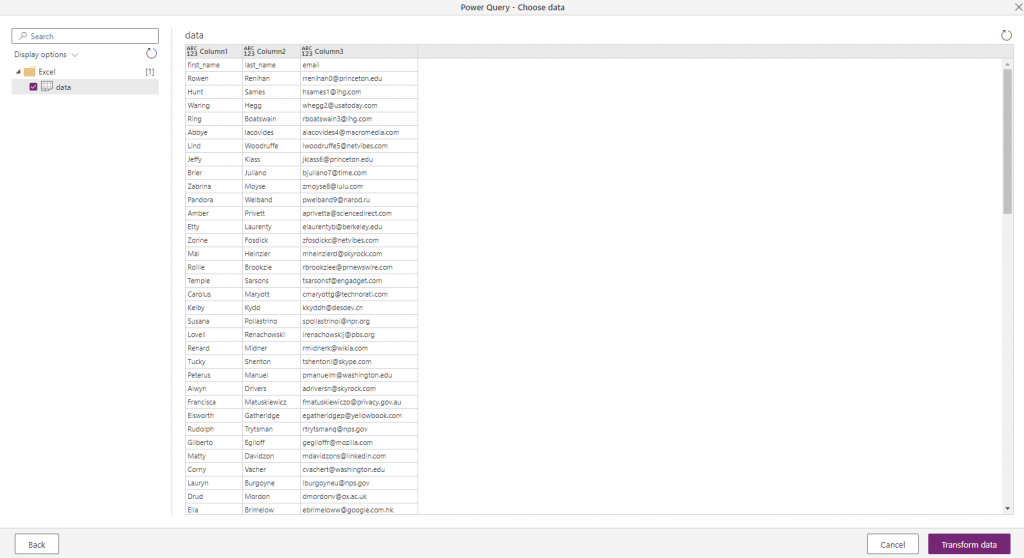
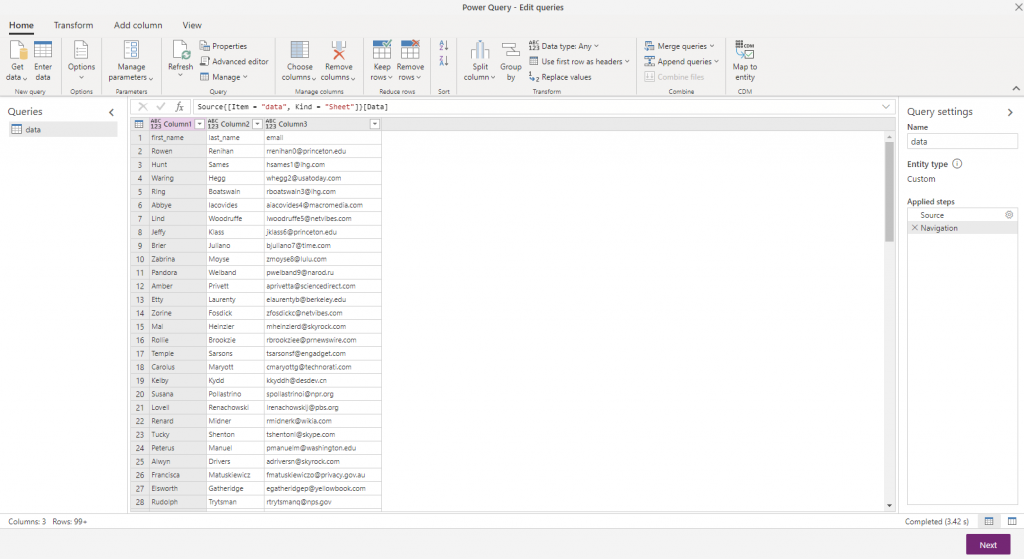
Clicking Transform Data takes me on to the next powerful step – building up a set of transformations to apply to the data before it’s imported. In my case I need to use the “Use first row as headers” option.
More transformations
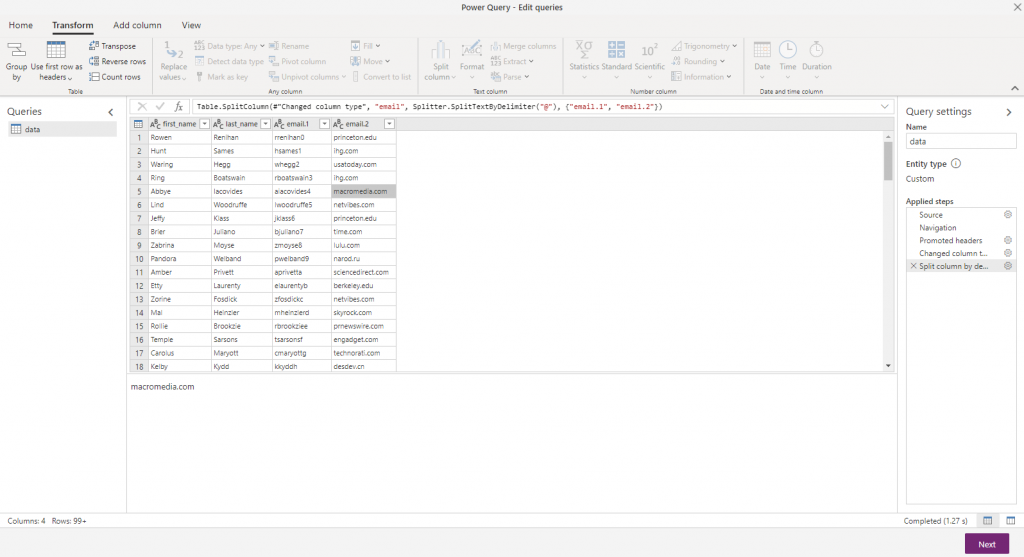
I might not want to put all this personal data into my data lake. For example, I might only need a total number of people in each company. I can do all this transformation at this point in a nice point-and-click interface. First I need to work out a company for each person – I can do this by splitting the email address and using the domain name part. Select the email field, then under the Transform ribbon I can use the Split column option. This gives me two columns, one with the mailbox name and another with the domain:
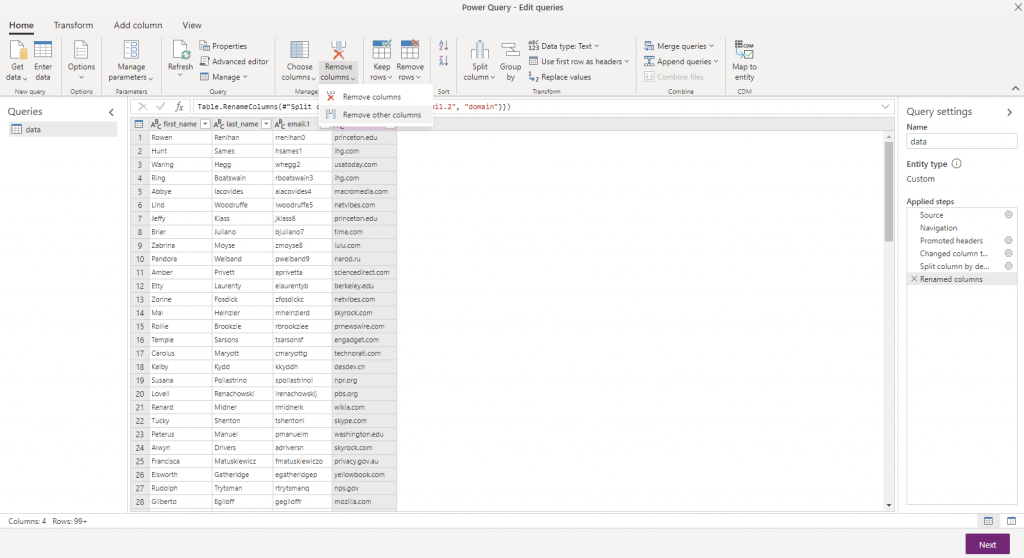
email.2 isn’t a very nice name though, so next I rename the column by selecting it, click the Rename option in the ribbon and enter domain instead. Now I can remove the other columns – with the domain column selected, on the Home ribbon I can click Remove columns, then Remove other columns to just leave the domain column.
Finally I want to summarize the data to get the number of people in each company. On the Transform ribbon I can use the “Group by” option to group my records by the domain name and generate a new column showing the number of records in each group. My final results look like:
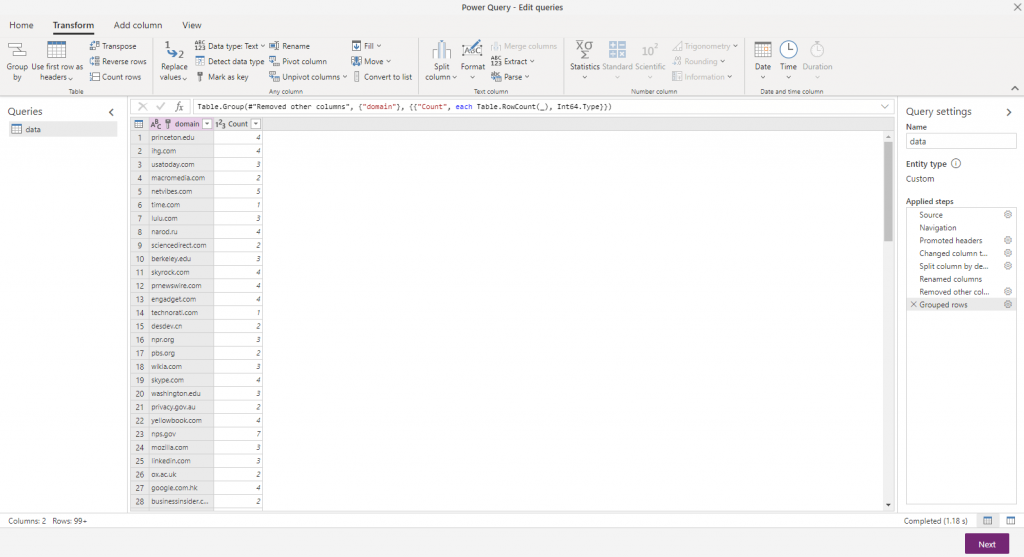
On the right hand side you can see all the transformation steps that this data has been through. This is essentially building up a repeatable ETL process. I can see the effects of it on the preview of data, but I’m not working just on this data – I can apply this same process multiple times. If I get something wrong I can remove or change a step from this process and try again.
Running the import
After I’ve finished building any transformations I want to apply, when I click Next I can choose to run this dataflow manually or automatically on a schedule. I want to run this as a one-off for now, so I’ve selected to refresh it manually, then clicked Create. This saves the definition of my dataflow so I can rerun it again in the future, and starts the first run.
After a few seconds the dataflow has finished and I can see the results in the datalake:
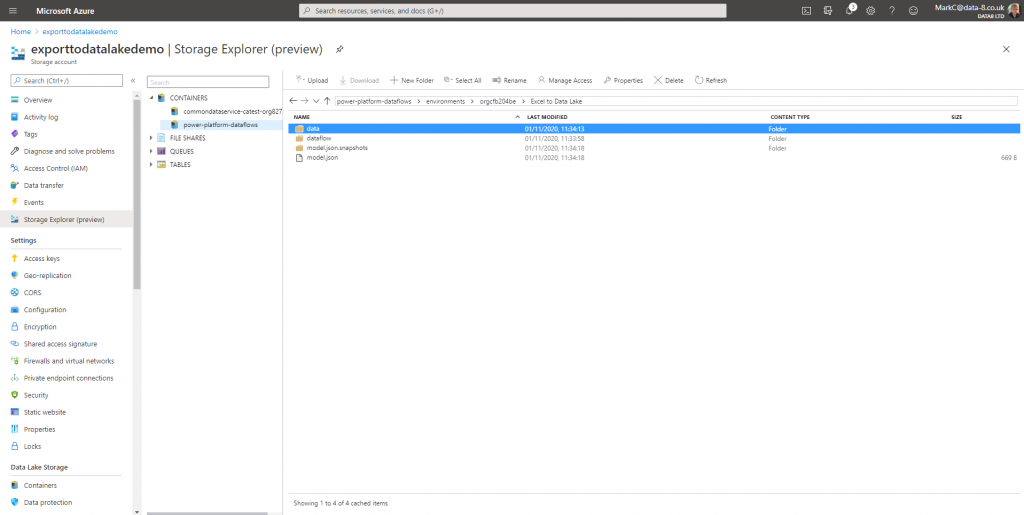
It’s automatically created a power-platform-dataflows container in the data lake. Inside that it creates a separate folder for each environment, and a subfolder for each dataflow. That folder holds the definition for the dataflow itself, as well as the CDM format data and metadata it’s just loaded.
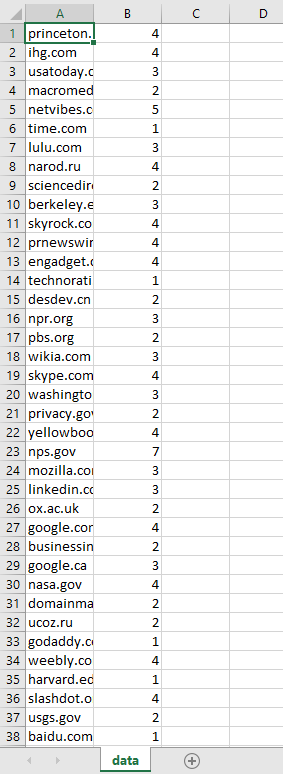
From the data folder I can download a CSV format file that contains the data and confirm in Excel that it looks as I’d expect:
So far I’ve managed to load my raw data from Excel, create an automated data transformation pipeline and store the results in CDM format in the data lake. Next time I’ll take a look at how I can access this data in Power BI to visualise it.